Unlock the power of data to drive smarter decisions and elevate your event performance from good to exceptional.
In today’s competitive event landscape, relying on intuition alone isn’t enough. Data-driven event planning allows organizers to uncover valuable insights, track what’s working, and optimize every stage of the event journey. From boosting attendee engagement to maximizing ROI, using data strategically can transform the way you plan, execute, and evaluate your events. By shifting from guesswork to focusing on event performance analytics, you can deliver more impactful experiences, backed by real results. This article explores the importance of data-driven decisions in achieving successful events and provides guidance on fostering a data-centric culture within event management.​
The importance of data in event management
Events—whether in‑person, virtual, or hybrid—are more complex than ever, and attendees now expect experiences tailored just for them. In fact, according to Knowland, 68.7% of event professionals say using technology to enhance the attendee experience is a trend that’s here to stay. At the same time, over half (52.1%) of organizers have seen attendance rise year‑over‑year, reflecting those growing audience expectations
Yet recognizing data’s value and actually using it are two different things. While 88% of event organizers agree that data analytics is crucial for measuring event success, many still fall short in practice: 23% don’t measure success at all, and 18% lack the right tools to evaluate their events effectively. This disconnect doesn’t just impact reporting—it limits opportunities to enhance the attendee experience. Without clear insights into what’s working and what’s not, organizers miss valuable chances to tailor content, improve engagement, and create more meaningful, personalized experiences for their audience.
Benefits of a data‑driven approach
- Personalized attendee experiences
By tapping into registration, engagement, and feedback data, you can tailor sessions, networking opportunities, and content to what your audience actually wants. - Smarter budgeting
Analytics reveal which elements drive the most impact—so you can allocate spend where it counts. - Higher ROI
Organizations leveraging event data have seen attendance jump by up to 20% and productivity increase by 27%.
Risks of ignoring data
- Wasted spend
Without insights, you risk pouring the budget into low‑impact areas. - Missed partnerships
Overlooking sponsor performance data can mean leaving high‑value opportunities on the table. - Stagnant growth
Ignoring new tools and trends can keep your events from reaching their full potential.
Key metrics to track for event success
Just gathering random event data is not enough, you need to analyze the right metrics to gauge the success of your event. Here are key event metrics that you should focus on:
Pre‑event metrics
- Registration conversion rate
What it is: The percentage of website visitors who complete the event registration process.
Why it matters: Reveals how compelling your event offer is and how frictionless your registration flow feels.
- Number of registrations by channel
What it is: The total count of registrations attributed to each marketing channel (e.g., email, social media, paid ads, referrals).
Why it matters: Shows which channels are driving the most sign‑ups, so you can double down on top performers and boost your overall ROI
- Ticket sales by type
What it is: Breakdown of early‑bird, VIP, and general‑admission sales.
Why it matters: Helps you optimize pricing tiers and event promotion strategies.
Operational metrics
- Check‑in rate
What it is: % of registrants who actually check in on event day.
Why it matters: Indicates how effective your communication with registered attendees and your on‑site mobile app check‑in process are, low rates can signal missed reminder emails, unclear instructions, or bottlenecks at entry points
Engagement & satisfaction metrics
- Session engagement
What it is: Quantitative measures such as average session duration (dwell time), poll response rate, and Q&A interaction count
Why it matters: Reveals which content formats and speakers truly resonate.
- Net promoter score (NPS)
What it is: Attendees rate how likely they are to recommend your event (0–10 scale).
Why it matters: A direct proxy for satisfaction and word‑of‑mouth growth.
Financial metrics
- Revenue per attendee
What it is: Total event revenue Ă· number of attendees.
Why it matters: Shows per‑person profitability and helps benchmark future budgets.
- Sponsorship ROI
What it is: Sponsor spend vs. leads generated or impressions delivered.
Why it matters: Proves value to partners and informs next year’s packages.
Marketing & digital metrics
- Social media mentions
What it is: Volume of posts using your event hashtag.
Why it matters: Tracks buzz and peer‑to‑peer advocacy in real time.
- Website/app engagement
What it is: Pageviews, session duration, bounce rate, or app downloads.
Why it matters: Indicates user interest and highlights drop‑off points.
By zeroing in on these KPIs, you’ll have a crystal‑clear view of what’s working, where to pivot, and how to prove ROI to stakeholders.
Tools and technologies for effective data collection
As an event organizer, you pour hours—sometimes months—into planning. But how do you know if all that effort paid off? That’s where collecting and analyzing event data, often called “event metrics”, comes in. It’s not just about counting attendees. It’s about understanding behavior, preferences, and engagement from the moment someone registers to the post-event survey they (hopefully) complete.
Data collection should happen at every stage of your event:
- Before the event: Track which marketing channels are driving registrations. Are more people clicking through your emails or Instagram ads?
- During the event: Use tools like RFID badges and QR codes to monitor session attendance, booth visits, or even dwell time in different areas.
- After the event: Collect feedback through post-event surveys or monitor social media sentiment to understand how attendees felt.
The right tools can make this seamless. Event management platforms combine registration, ticketing, and communication, reducing the need to bounce between multiple systems. CRMs help you keep track of interactions and preferences, so you can personalize your follow-up. Mobile apps give attendees a smooth experience while offering you live insights into what they’re engaging with most.
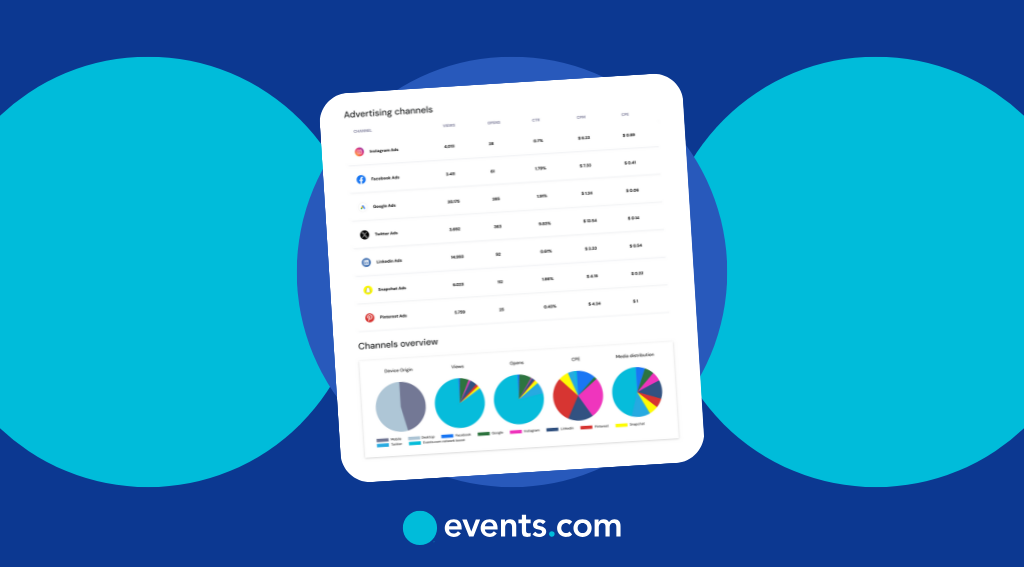
And for a deeper layer of insight, platforms like Events.com Insights go even further. You get access to detailed analytics and marketing performance reports in one dashboard, no third-party analytics tools required. Plus, you can run automated marketing campaigns across 10+ channels, pulling from your event listing details to save time and maximize reach.
All this data isn’t just for reporting, it’s a feedback loop. The more you know about what worked (and what didn’t), the more you can refine your strategy and deliver successful events.
Analyzing data to drive event strategy
Once you’ve collected your data, the next step is to analyze your event performance analytics. Start by sorting your findings into quantitative (numbers, counts, survey scores) and qualitative (comments, interviews) data. Load your quantitative data into Excel or Google Sheets and build simple charts to identify key trends and patterns. At the same time, review your qualitative notes to uncover attendee sentiments and pain points.
Next, use business‑intelligence tools—like Power BI, Tableau, or Google Data Studio—to dig deeper. These platforms let you segment your audience, personalize marketing campaigns, and optimize event logistics based on real insights. A data‑driven approach ensures your strategies align with attendee expectations and current market trends, leading to smoother operations and better ROI.
Case studies: success stories of data-driven events
Interested in real-life examples of how data-driven strategies contribute to event success? Here are a few noteworthy cases:
1. Tech conference: Personalized agendas enhance attendee satisfaction
At Digestive Disease Week (DDW), organizers implemented heat mapping over three consecutive years to analyze attendee movement and session popularity. This event data analysis allowed them to optimize session scheduling and room assignments, leading to improved attendee experiences and operational efficiency. ​
2. Music festival: leveraging social media for ticket sales
The Savannah Music Festival utilized digital advertising campaigns to boost ticket sales. By running retargeting ads aimed specifically at website visitors who had reached the ticket‑checkout page but abandoned their purchase, they reached over 22,000 individuals, resulting in 148 additional ticket‑sale transactions. This approach significantly expanded their audience and increased revenue.
3. Trade show: utilizing heat mapping for booth optimization
The Annual Hotel Conference leveraged VenuIQ’s live heat mapping technology to optimize the attendee experience in real time. By equipping attendees with Bluetooth Low Energy (BLE) devices on their badges, organizers were able to generate dynamic heat maps that revealed high-traffic areas throughout the venue. This real-time data allowed them to adjust layouts and reallocate resources on the fly, preventing bottlenecks and ensuring a smoother flow of foot traffic. After the event, insights from the heat maps informed better booth placement and smarter session scheduling for future conferences.
These examples demonstrate the tangible benefits of integrating data-driven strategies into event planning, leading to enhanced attendee satisfaction, increased sales, and optimized event layouts.
Implementing a data-driven culture in your event team
1. Establish and communicate clear KPIs
Begin by defining the handful of key performance indicators (KPIs) that matter most to your events, like registration conversion rate, check‑in rate, and session engagement metrics. Clarifying these metrics up front ensures everyone knows what success looks like and why each data point matters.
2. Develop a roadmap and assign responsibilities
With KPIs in place, create an event operational plan that outlines your event goals and maps each metric to specific team members. Assign ownership for data collection, analysis, and reporting so that everyone understands their role in driving insights.
3. Invest in training and tools
Equip your team with both the tools and the skills they need. Offer data literacy training, covering basics like interpreting dashboards and running simple analyses, and hands‑on workshops for your chosen event tech platforms. This foundation guarantees that the data you gather is accurate and actionable.
4. Lead by example and foster experimentation
Leaders should champion data‑driven decision‑making by asking questions grounded in metrics and supporting small‑scale experiments—turning opinions into testable hypotheses. This approach not only speeds up decisions but also builds confidence in data’s power to guide your strategies.
5. Share successes and iterate
Regularly review performance against your KPIs, celebrate wins (like a 20% lift in registrations from a new event invitation email variant), and share those stories across the team. Use each event as a learning opportunity, refining your roadmap, adjusting KPIs, and iterating on what works best.
By starting with clear KPIs and reinforcing them with a structured plan, targeted training, leadership support, and continuous iteration, you’ll cultivate a data‑driven culture that elevates every event you run.
How to utilize Events.com to tap into your event data
​If you’re looking to implement data-driven strategies in your events, consider Events.com. This comprehensive event management platform offers a suite of tools designed to help organizers collect, analyze, and act upon event data effectively. With features like real-time analytics dashboards, customizable reports, and integration with external analytics tools, Events.com empowers you to transform raw data into actionable insights. This data-centric approach ensures your event strategies align with attendee expectations and market trends, leading to enhanced experiences and improved outcomes. To explore these features firsthand, sign up on Events.com today and request a free demo. ​
Frequently asked questions about data-driven strategies
1. What are data-driven strategies?
Data-driven strategies involve collecting and analyzing data to inform decision-making, enhancing event planning and execution. ​
2. What are the 5 steps of data-driven decision making?
- Define Objectives: Establish clear goals and key performance indicators (KPIs).​
- Collect Data: Gather relevant data from various sources.​
- Analyze Data: Examine the data to identify patterns and insights.​
- Make Decisions: Use insights to inform strategic choices.​
- Review and Optimize: Assess outcomes and refine strategies as needed. ​
3. How does data-driven decision-making help in business?
Data-driven decision-making minimizes bias and subjectivity, leading to more accurate and efficient decisions based on empirical evidence. ​